In this blog, learn about statistical process control’s (SPC) ability to lower facility costs, reduce waste, and increase efficiency. Through SPC, discover product consistency like never before and learn how to implement it at your site.
Learn how to keep processes in check with dataPARC’s powerful limit and spec monitoring tools.
Industrial sites are most successful when they produce high-quality products efficiently and effectively. A proven method to achieve this success is by utilizing a system called Statistical Process Control (SPC). Implementing SPC at your site unlocks new levels of performance by enabling data-driven decision-making, reducing waste, and enhancing manufacturing consistency. Let’s dive into what SPC is, why it matters, and how to bring it to life at your facility.
What is SPC? And a Brief History
SPC is a data-driven approach to process control. It provides tools to understand, monitor, and improve processes over time, primarily through statistical methods. SPC was pioneered in the 1920s by Walter A. Shewhart. Shewhart introduced the concept of distinguishing between common cause and special cause variation in a process. His work laid the foundation for tools like the control chart, which is still central to SPC practices today.
Today, SPC is used across industries, from manufacturing to pharmaceuticals, to help teams monitor performance and proactively manage quality.
Common Applications of SPC
SPC is a versatile tool and can be applied in every industry. Some of the most common applications come from manufacturing, chemical processing, and machine monitoring. Applications in manufacturing are helpful in reducing scrap and defective products, scheduling preventative maintenance to keep machines online, and improving product consistency.
Additionally, equipment monitoring can bring awareness to early signs of wear or malfunction. Better control over variables such as temperature and concentration can be had with chemicals to promote batch consistency and quality.
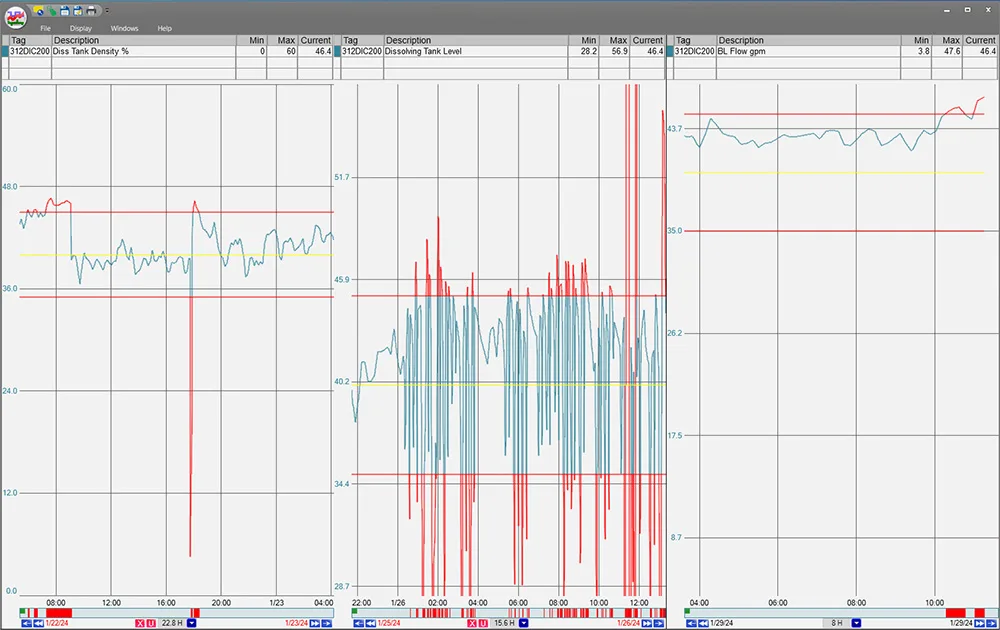
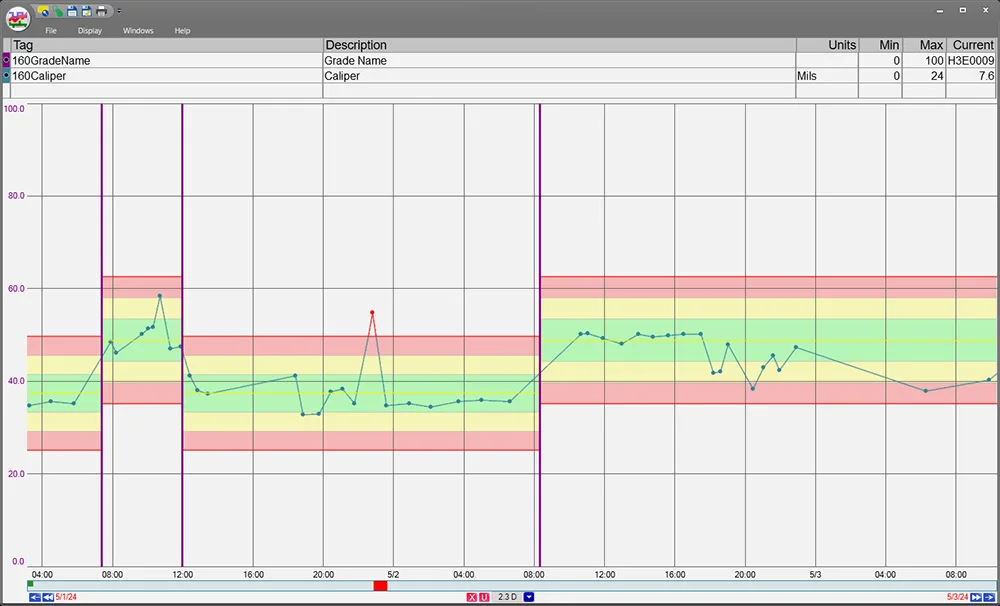
Utilizing trends with limits lets operators see when specs exceed the desired range. dataPARC’s limits help maintain and monitor processes.
Let’s imagine a scenario where SPC helps to solve a problem. Imagine you are running a paper mill producing release liner using polyethylene (PE) as your coating. Over the past month, your mill has experienced an increase in sheet breaks. Wanting to get to the bottom of this, you decide to look over the machine and finishing data using control charts to find where the discrepancy began to occur. You generate a c-Chart, which will be covered later in this blog, over the last months’ worth of found defects on finished rolls.
There, it is shown that the number of visual defects has increased, and the majority have been noted as dark spots, leading you to investigate the coating section of the machine. Checking through the process, you look through recent work orders in the area and find that the replacement of the coating roll’s doctor blade has been missed, leading to improper cleaning of the roll.
The maintenance team changes out the blade, and the machine begins to run like normal. For this problem, we were able to use control charts, a vital part of SPC, to help us find the cause of the sheet breaks.
Why You Should Use SPC
Implementing SPC isn’t just about tracking charts; it’s about reaping measurable benefits. In the industrial process, these include the lowering of operational costs through early detection of issues and increased operational efficiency by process optimization.
Additionally, you are creating consistent and quality products through low variation, which in turn results in fewer wasted products through defects. Overall, SPC leads to smarter, data-proven decisions that reduce guesswork.
Check out dataPARC’s real-time process data analytics tools & see how better data access can help your business.
Steps to Implement SPC
1. Understand the Value
Begin by identifying how SPC would most benefit your site. Are you looking to reduce waste? Improve consistency? Consider the big picture: How could other teams, like maintenance or engineering, leverage the same data?
2. Select Processes and Define KPCs
Choose the most critical processes to quality or performance and define their Key Process Characteristics (KPCs); the measurable features that affect output. KPCs can be a variety of different metrics, like downtime, speed, and yield. It is important to ensure that the features you choose to measure are relevant to the process.
3. Establish a Data Collection Method
It is imperative to have a dedicated data collection method. This can be done in many ways such as with manual data entry (MDE), sensors, and programmable logic controllers (PLCs). While automated data collection is widely seen as the go-to choice, it is possible to use SPC and manually gathered data together.
Although manual data can tell the story about site happenings, it comes with its own set of challenges. Manual data is not up to date; such delays can cause long reaction times in addressing problems. Additionally, there is an increased risk of human error. However, with proper documentation guidelines and scheduled data collection, manual data can be trustworthy and useful to SPC.
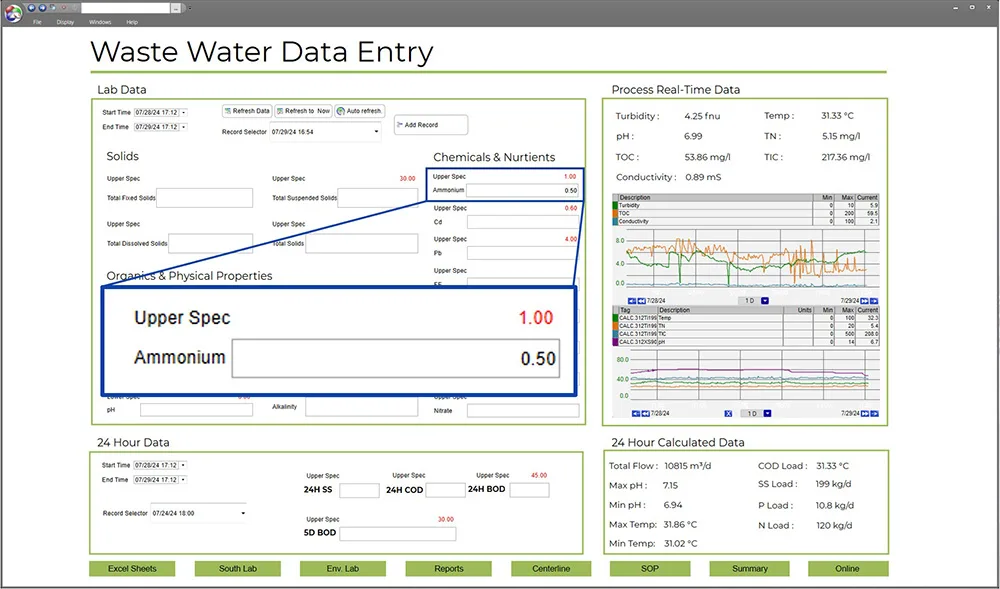
MDEs play a critical role in updating site operations. With dataPARC’s MDE display, manual data is easy to collect and even easier to utilize with SPC.
Regardless of collection method, most SPC systems require at least 20 points of data to establish a baseline, but these points can be taken at any frequency that best fits your system. Realistically, each sample point will require different collection frequencies.
4. Set Up Control Charts
Control charts are vital to utilizing SPC. These tools are used to monitor, control, and improve processes over time. Their visual displays demonstrate how processes change over time and can be used to help determine normal operating conditions such as baselines or limits or make users aware of unusual variations. Control charts can be categorized into two categories: variable data charts and attribute data charts.
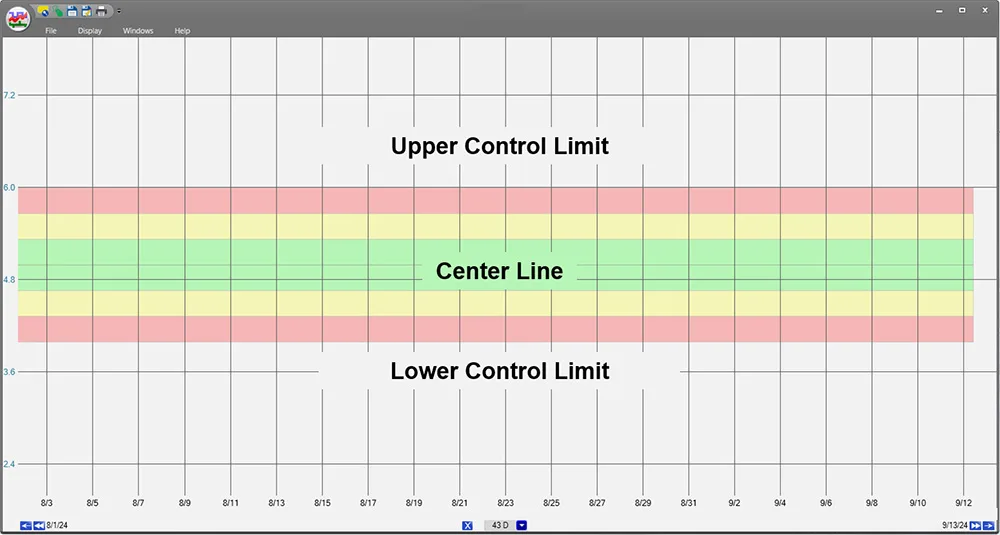
This example also features shaded zones c, b, and a, representing one, two, and three sigma deviations from the centerline, respectively. Setting up a control chart is the first step to utilizing advanced analytics.
Variable data charts are used to measure quality characteristics being measured in a continuous variable such as temperature or weight. The most commonly used variable data charts are x-bar and R, x-bar and S, and I-MR. X-bar and R charts, as well as x-bar and S charts, are best used when dealing with ‘subgroup data’, which refers to data where multiple samples are taken simultaneously.
X-bar charts monitor the average of the subgroup, R charts track the range within each subgroup, and S charts track the standard deviation within each subgroup. Unlike the other variable charts, I-MR tracks individual measurements, displaying the moving range of individual data points.
Attribute data charts measure quality characteristics on a count basis rather than continuously. A count could be any kind of discrete, categorical data, such as the number of broken blades on a fan or whether a pump passes or fails inspection. These charts are best utilized to promote and achieve process stability through monitoring, detection, and signaling. Most commonly, p-, np-, c-, and u-Charts are used to perform this.
P- and np- Charts are best used in tracking defects, giving way to find the proportion of defective items in a chosen sample or subgroup. Counting defects is best done with c-Charts and u-Charts where an individual unit’s defects are being tracked, like dents in a soda can after it comes off the line.
In addition to control charts, consider other visual tools like Pareto charts and histograms that can help you to prioritize issues that arise from common defects or chronic data outliers.

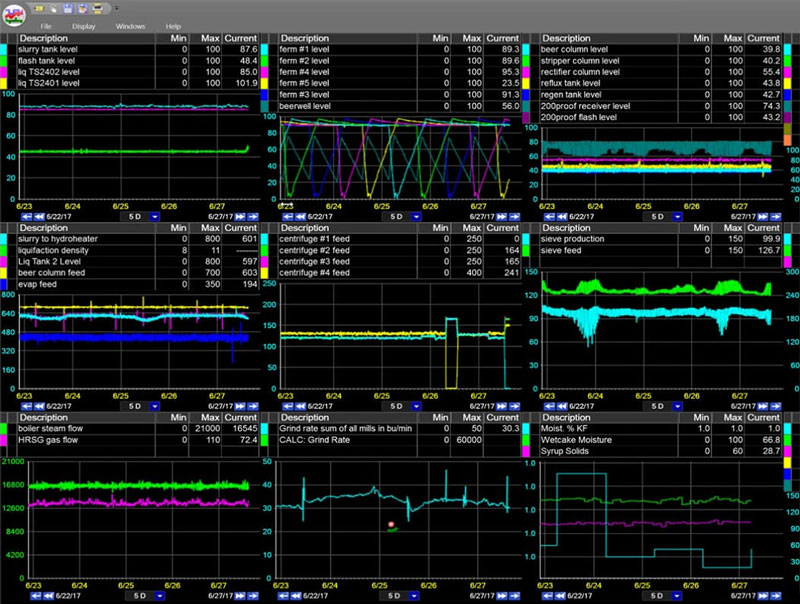
Unlock the full potential of big data with dataPARC’s tools and features.
5. Analyze Results and Take Action
Once charts are populated, it’s time to start analyzing. You will gain the most understanding from your control charts if you interpret them using the seven rules of SPC:
- Rule 1: One point beyond the 3σ control limit; identifying outlying points.
- Rule 2: Eight or more points on one side of the centerline without crossing; checking for a prominent shift.
- Rule 3: Four out of five points in zone B or beyond; checking for small shifts.
- Rule 4: Six points or more in a row steadily increasing or decreasing; finding trends.
- Rule 5: Two out of three points in zone A; checking for a large shift.
- Rule 6: 14 points in a row alternating up and down; overcontrol.
- Rule 7: Any noticeable/predictable pattern, cycle, or trend; out of control.
Utilizing these rules allows you to see signs of failure before they appear. Defects can appear for a variety of reasons, from tooling issues to distracted operators.
Some examples of how these can manifest are a flow decrease in a pipe due to excessive stock consistency, increased vibrations on a pump, or a significant change in temperature of a reactor. To stop signs of failure, take preventive steps to remedy the situation. Preventative action can include creating alarms to warn if a machine unexpectedly shuts down, or programming a report or MDE cells to change colors depending on their value.
If you don’t catch the event before it happens, SPC can also assist in corrective action. Control charts, in conjunction with the seven rules, can show you when the data values started changing and aid in facilitating a search for the problems cause.
6. Standardize and Scale
When you find a successful SPC implementation, make sure to document the process, train your team, and apply it to other areas, shifts, or sites.
The goal is to standardize success and build a culture of quality.
Continuous Improvement
SPC isn’t a one-time project; it’s a continuous improvement cycle. As you monitor data and refine processes, you’ll uncover new opportunities to improve and optimize. Keep challenging your benchmarks and expanding your SPC program to new areas of the business.
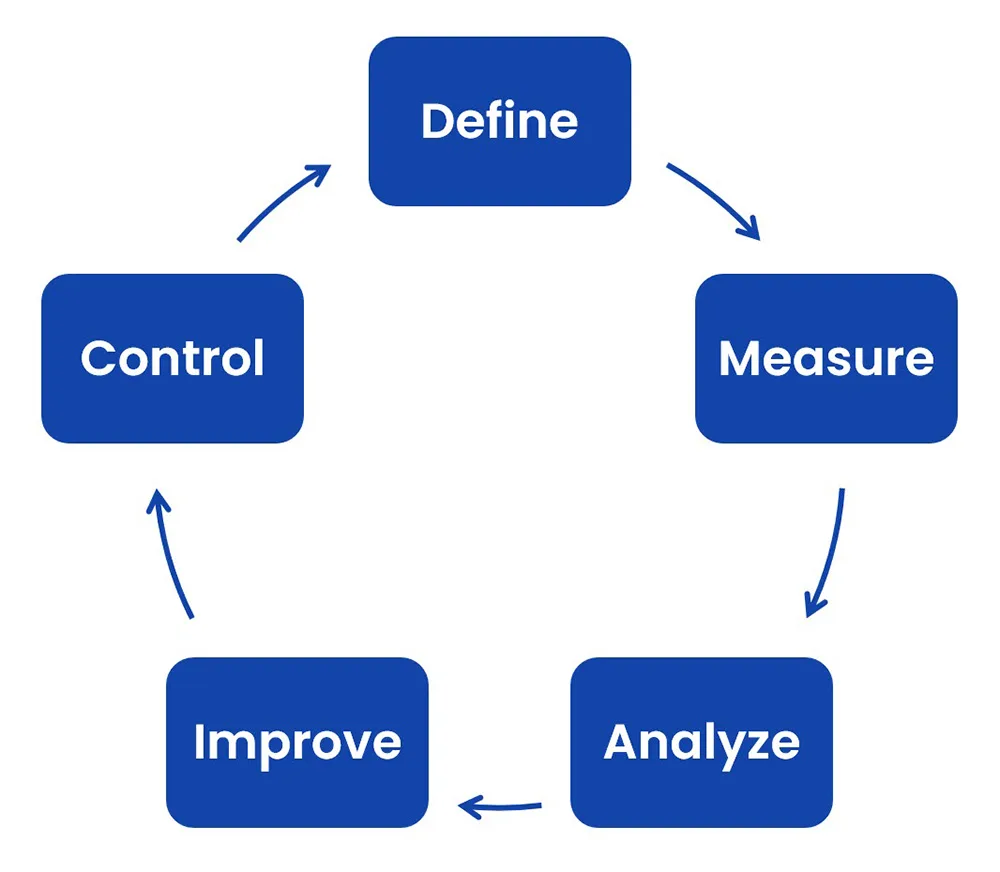
DMAIC provides a structured framework for continuous improvement, helping you refine SPC over time to drive consistent gains in product quality and process performance.
Final Thoughts
SPC is more than just charts and numbers; it’s a powerful framework for driving quality, efficiency, and confidence in your processes. By following these steps, SPC implementation can move your site from reactive firefighting to proactive, informed decision-making. Whether you’re starting small or rolling out SPC site-wide, the long-term value is well worth the effort.
FAQ: SPC Implementation
- What is Statistical Process Control?
Statistical Process Control (SPC) is a data-driven approach using statistical techniques to control the quality of production processes. - What is the difference between control limits and specification limits?
Control limits are statistical boundaries on a control chart that are the acceptable range of variation within a process. Specification limits are set by the customer or company, defining their own unique, acceptable range for a product or process. - What processes can SPC be applied to?
Statistical Process Control can be applied to any process. From chemical to automotive, SPC can be implemented in any facility. - How do control charts help reduce defects and waste?
Control charts help to alert you to any out-of-range variations that are happening in your process. This could be through a p-Chart, x-bar and S Chart, or one of many other chart options that can be used in SPC.
Mastering Manufacturing Metrics
The Ultimate Guide to Establishing, Measuring, & Reporting KPIs for Peak Plant Performance